Cookie Notice

We use cookies to ensure you get the best experience on our website. By continuing to use our site, you accept our use of cookies, privacy policy and terms of service.

ESC

Search

SPC XL Features Buy Now Free Trial System Req. Version History Compare
SPC XL

SPC XL Features

Control Charts, Hypothesis Testing, Analysis Diagrams, MSA, and more — all inside Excel.

SPC XL Features Overview

Full Feature List

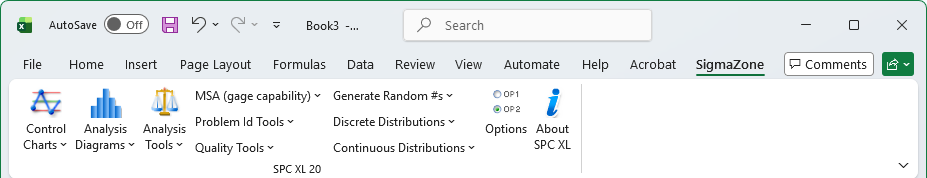
Everything included in SPC XL — nine toolsets covering statistical process control, analysis, and quality management.

Control Charts

  • Control Chart Wizard to help pick optimal chart
  • Update control charts without recreating them
  • Mark outliers — still plotted but do not affect control limits
  • Cpk and Ppk analysis optionally created with Control Charts
  • XbarR Chart
  • Xbar S Chart
  • Individuals Moving Range Chart
  • n Chart, p Chart, np Chart, u Chart

Analysis Diagrams

  • Diagram Selection Wizard to help pick the best diagram
  • Histogram with Normal Overlay
  • Capability Analysis Diagram (Cpk)
  • Scatter Plot with regression fitting
  • Pareto Chart
  • Summary Stats with Dot Plot
  • Box Plot

Analysis Tools

  • Multiple Regression
  • Correlation Matrix
  • t-Test
  • F Test
  • Independence Test
  • Test of Proportions
  • 1 Way ANOVA
  • Confidence Interval
  • Sample Size Calculation

Measurement System Analysis (Gage R&R)

  • MSA Template to aid in data entry
  • ANOVA Analysis
  • XbarR Analysis
  • Attribute Analysis

Quality Tools

  • Main Effects Plot
  • Unstack Columns
  • Run Chart
  • Cusum Chart
  • Product Capability Report
  • FMEA
  • Xbar ± 3s Chart

Problem Identification

  • Display flow charting toolbar
  • Create PF/CE/CNX/SOP Template
  • Create PF/CE/CNX/SOP Diagram

Continuous Distribution Calculators

  • Chi-Squared
  • Exponential
  • F Distribution
  • Gamma
  • Lognormal
  • Normal / Standard Normal
  • Student's t
  • Uniform
  • Weibull
  • Inverse distributions

Discrete Distribution Calculators

  • Binomial
  • Critical Binomial
  • Hypergeometric
  • Poisson
  • Negative Binomial
  • Uniform

Microsoft Excel Integration

  • Store, analyze, and present results within Excel
  • No copying or pasting data to external software
  • Results output directly into your workbook
  • Dedicated ribbon tab for easy access
"I have studied and applied several leading statistical software applications over the last 9 years. I have instructed statistics to hundreds of Black Belts. I always launch SPC XL first. It is the easiest statistical software to use, and has met 99 percent of my statistical needs."

Thomas C. Stroup — Lockheed Martin Inc., P.E., Lean Six Sigma Black Belt